How to Measure Variation in Data?

In the last post we've discussed about central tendencies, and how they can help us understand where the data is mostly centered around. However, this begs the question of how to understand the variation in the data.
I mean from our earlier example for understanding mean central tendency, we know that we can replace each data point in our data with the mean and still get the same mean value. However, just because the mean for two data collections is same that doesn't necessarily mean that the data is same as well. Can you guess what's the difference?

The difference is that now we have zero variation in our data as all the values are equal to mean.
The ability to calculate and measure the variation in data alongside it's central tendencies, help us fully understand how the data is spread and where it lies.
There are many different ways to calculate variation in data, however, a few of those are the most commonly used and the most critical to understand from a statistical perspective. These include Range, Mean Absolute Deviation, Variance and Standard Deviation. Let's go through these one by one.
Range
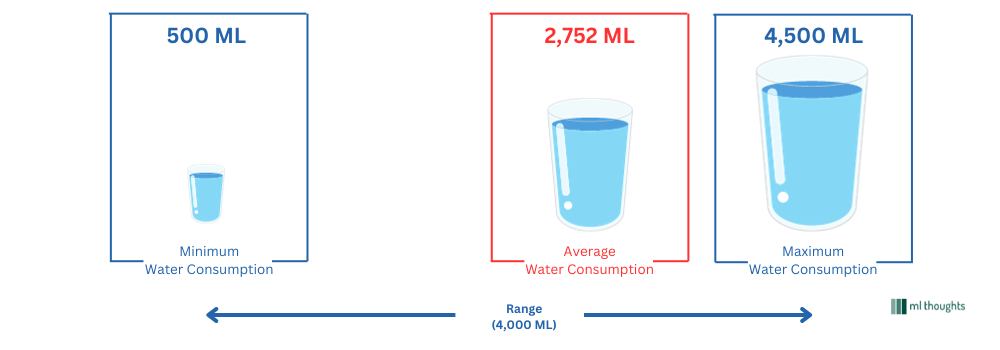
Range is the difference between the highest value and lowest value in the data. If you think about it, it actually makes perfect sense as the difference between highest value and the lowest value gives you the spectrum width in which the values can exist i.e. a range.
Let's say you measure how much water you drink everyday and you measure the water consumption everyday for the next 14 days. Once you have this data just calculating the mean will give you a value like $ \text{2,752 ml} $, which implies that on average on a given day you drink about $ \text{2,752 ml} $ of water, however, just by itself, this mean doesn't give you any idea of how much variation in the data was present. For example, it might be possible that on one particular day (the day you drank least amount of water) you just drank about $ \text{500 ml} $ of water and on another day (highest water consumption day) you drank more than $ \text{4,500 ml} $ of water depending upon various factors. As you can see, if we combine the central tendency (in this case average value of $ \text{2,752 ml} $ of water) with variation (range of $ \text{4,000 ml} $ of water), it gives you a much better understanding of the data.

Alright, now that you know about range, can you think of any downside of this metric. In what situation using range as measure of variation in data would be not appropriate. Think about it and then continue reading as the answer is in the next paragraph.
I just told you that range is computed using the difference between the minimum and maximum values in our data. That means that we are dealing with extreme values. What if there's an outlier on either side of these extremes. Of course in this scenario your range is calculated based on the value of those outliers. In other words, range is vulnerable to presence of outliers in the data and thus is not always suitable.
Mean Absolute Deviation
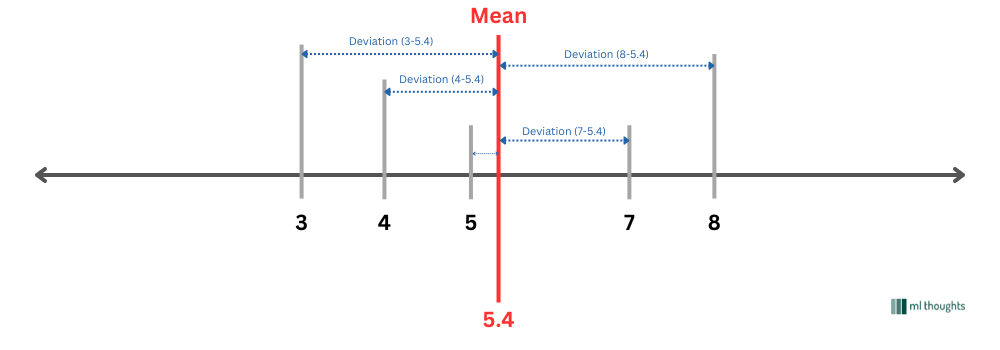
In order to solve the issue with the "Range" metric of variation in data, let's dive into another metric that's used in measuring variation i.e. Mean Absolute Deviation. The idea behind Mean Absolute Deviation is that variation can be measured in terms of distance of each value from the mean of the collection.
So if we've 5 values, say, 4, 7, 5, 3, 8.
$$ \text{Mean} = \frac{4+7+5+3+8}{5} = 5.4 $$
The difference between mean (i.e. 5.6) and any particular data point in our data (for eg. 4) is called deviation, simply because it's seen as a deviation from the mean value.

In our data, the data points and their corresponding deviations can be calculated as follows.
| Datapoint | Mean | Deviation |
|---|---|---|
| 4 | 5.4 | $ 4 - 5.4 = -1.4 $ |
| 7 | 5.4 | $ 7 - 5.4 = 1.6 $ |
| 5 | 5.4 | $ 5 - 5.4 = -0.4 $ |
| 3 | 5.4 | $ 3 - 5.4 = -2.4 $ |
| 8 | 5.4 | $ 8 - 5.4 = 2.6 $ |
Now once we have the deviations for all the points we take the mean of those deviations.

Oops, that didn't work out as we wanted it to. But why is that. Hmm, let's think about it. We first calculated the mean of the data and then we calculated the distance between each value and the mean and added those distances. Well of course we will get a zero value after the sum because the distances on the left hand side of the mean is going to be exactly equal to the distances on right hand side of the mean. Well, no worries, we can just take the absolute value of each deviation instead of the actual value as we are more interested in the variation amount rather than the direction of the variation.
Let's calculate the mean of deviations after taking the absolute value of deviations.

and there you have it the non-zero value for Mean of Deviation using the Absolute value of deviation, or in other words Mean of Absolute Deviation.
Mathematically, Mean of Absolute Deviation is represented as,

Variance
Variance which is our next type of measure for variation in data is very similar to the mean absolute deviation with only one particular difference. Instead of using absolute value to have a positive deviation value, it uses square of the deviations.
There are a couple of benefits for using squares over absolute values. Primarily, it's much more easy to do a lot of mathematical operations with squares including calculus based operations.
In our above example, for values $ \text{4, 7, 5, 3, 8} $

Now, because we calculated variance using squares, there's one important thing to note here. Due to squaring, the unit in which we represent variance is the square of the unit of the actual value. So for example, if you were calculating the variance of $ \text{number of steps you walked last month} $, then the variance unit would be $ Steps^{2} $.
Standard Deviation
If you are still reading, then I am going to assume that you have understood everything, that has been explained so far. And if that is truly the case, then understanding standard deviation is extremely simple. Why? Because Standard deviation is nothing but the square root of variance.
$$ \text{Standard Deviation}(\sigma) = \sqrt{\sigma^{2}} $$
Now as you can probably see, because standard deviation is the square root of variance the unit of standard deviation is the same as that of the actual values on which you were doing the calculations. So for our number of steps example, the unit of standard deviation in that case would steps as well.
If you are not aware of levels of data, please go through the 1st part of this series - Levels of Data
And with that let's wrap this discussion on variation in data. I hope that you've been able to understand the reason of why it's critical to measure variation in data in statistics. In the next post in this series, we start our discussion on one of the most fundamental and perhaps most used concepts in statistics "Probability".
Make sure to leave your questions, doubts and feedback in the comments section below. I regularly answer the comments (especially any doubts/questions) listed in the below comments section.
