Statistics 101 - Central Tendencies
In this post, We dive into central tendencies in statistics, like mean, median, and mode. The post explains why they're key for anyone starting in data analysis. It's a casual take on how these concepts play out in real-world data, highlighting their strengths and pitfalls.

If you haven't read the previous articles, I would recommend you to go through them, especially, if you are not aware with those topics. Below are the links to all the articles published in this series so far.
1 - Types of Data
2 - Essential Data Visualization
3 - Central Tendencies (You are here)
In this post, we are going to understand what do we mean by central tendencies in statistics and why do we use them?
Why even use Central Tendencies in the first place?
Have you have ever bought anything on Amazon? Of course you have, who haven't? Now being a smart customer that you are, you must be aware of the ratings metric each product have on the amazon website. Now let's say you are thinking of buying a product which has been previously bought and rated by $ \text{450} $ people. You look at the rating of the product and then decide based on whether it's a good rating or not. This rating that you just looked at is usually the average of all the ratings given by the 450 people who had previously purchased this product.
Now let's suppose, Amazon doesn't provide you this average value of rating for this product that you are currently exploring on Amazon and instead it provides you with all the 450 ratings from each respective customer of this product. What would be your reaction then? Well, I would frankly be a bit upset because now I have to somehow figure out based on these 450 ratings, what the overall feedback (likeability) of this product is.
I hope you are starting to see my point, of why central tendencies such as average and many more of it's siblings are crucial. Central tendencies gives us a general idea of where the majority of data lies. It's a way of summarizing data so that we can communicate about it much more efficiently. In other words, rather than giving me a excel sheet of 450 ratings just give me a single value that gives me an overall understanding of how people rated this product.
Now that you have a grasp of why central tendencies are required and what is the problem that they are solving, let's take a look at different type of central tendencies and where they are most useful.
Mean
Mean (or more commonly known as average) is the most used central tendency. The idea of mean is pretty simple i.e. to sum all the values present in the data and divide by the number of values. This gives you a good approximation of where the data is mostly centred around.
Another way of thinking about mean is that let's say if we have 5 values 2, 4, 5, 3 and 8, then in that case the mean will be
$$ \frac{2 + 3 + 4 + 5 + 8}{5} = 4.4 $$
which means that each value can be replaced 4.4 without changing the average value of the collection.
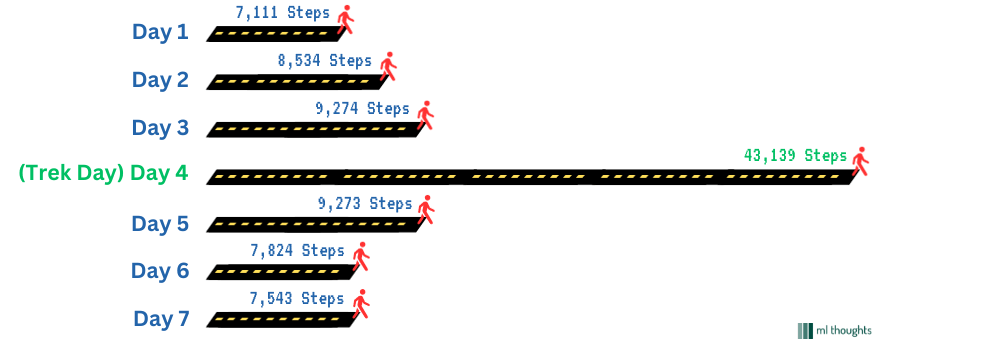
Average (or mean) usually works great, however, there is a scenario where using Mean might not be in your best interest. To understand, let's talk about another example, let's say you want to calculate how many steps do you walk on an average every day so you can use that for your custom diet plan. For this, you buy a nice smart watch and set it up to measure the steps you are walk everyday. Your goal is to do this for the next 7 days to get a good amount of data for which you can then calculate the average number of steps walked per day. Now you are doing this experiment and everyday you are walking somewhere between 7,000-9,000 steps. Hey, that's quite good actually. Now while doing this experiment, on the 4th day your friends invite you to a trekking trip in the mountains and the trip is about 11 kilometres of trek on each side, so a total of 22 kilometres worth of walking. Now I don't know about you but most people generally don't walk that much everyday. So obviously, on the trekking day the number of steps skyrockets and approaches about 43,000 steps. Now I think you might start to see where I am going with this. Upon completion of your experiment on the 7th day, your final data looked something like this,

Using the above data you calculated your average steps and it came out to be,
$$ \frac{7,111 + 8,534 + 9,274 + \color{red}{43,139} + 9,273 + 7,824+ 7,543}{7} = 13242.57 $$
For some of you it might be clear what's wrong here, but let me just clarify so that everyone is on the same page. Your goal was to measure the average number of steps you take per day for your diet plan. Assuming that you rarely go for such an extraneous trek (which is true for most people), the average number of steps, if you wouldn't have gone to the trek, would have been somewhere around 8,000. But because of the 43,000 steps that you walked on the 4th day, the average shot up to 13,242 steps which is about 5,000 steps more than what it should have been. If you use the 13,242 steps for making your diet plan you would be making an extremely big mistake. This is the scenario where you should be cautious about using mean (or average value). The scenario when there is a possibility of an outlier in the data that is too extreme and is usually not present in the values.
Median
Now let's talk about another central tendency called median, while talking about mean we discussed that it's heavily affected by outliers, so we should be cautious about using mean when we know that outliers are or might be present in our data.
Median, doesn't suffer from this issue of outliers. We will discuss why that is in just a moment, but before we do, let's quickly go through the actual definition of median. Simply speaking, Median is the middle value of the sorted data.
Let's say you have a list of numbers $ \text{3, 1, 4, 1, 5, 9, 2, 6, 5} $ and I ask you to calculate it's median. To do that, you will first sort the data in increasing order i.e. $ \text{1, 1, 2, 3, 4, 5, 5, 6, 9} $ and then get the middle value from that sorted list i.e. 4. So our median in this case is 4. Here's a more visually appealing illustration on how median works.
What is Median?
Now, I think it's pretty obvious why outliers don't affect median, right. Once you sort the data, the outliers are usually going to be either on the extreme right side or on the extreme left side and irrespective of that, we just select the middle most value, which isn't going to change because of those outliers.
Median is useful when you know your data has a lot of outliers or potential for a lot of outliers and the data is symmetric otherwise. (Don't worry if you don't know what symmetry in the data means. It's explained in the future articles of this series)
Mode
Let's say you were interested in counting the number of cars of each colour in your apartment parking lot. You went to the parking lot, and counted the number of cars for each colour you spotted. Eventually you ended up with data as given below.
| Color | Number of Cars |
|---|---|
| Black | 25 |
| White | 20 |
| Gray | 10 |
| Red | 5 |
Now in this case if I ask you to calculate the central tendency of your data, will you be able to do it with mean or median? I mean of course, if you want you can calculate the mean value of number of cars which will be 15.
$$ \frac{25 + 20 + 10 + 5}{4} = 15 $$
But as you would have realized by now, this mean value is not really making any sense in this scenario. Think about it, what does this mean tell you. It's the average number of cars per category, but that's not of much use in this case.
However, if we go back to the principal definition of central tendencies, in a general sense it says that a central tendency should be able to correctly describe the central or most common features of your data.
In this case, the most common aspect of the data would be the car color that you encountered the most. In other words, the car color with highest number of cars will be a much appropriate central tendency in this case i.e. Color - Black with 25 cars. In statistics, this is called the mode of dataset.
Mode is the most frequently occurring value in the dataset and is a very effective central tendency when you are dealing with qualitative (or categorical) data.
That's all for this article. In the next article we discuss about percentiles and quartiles as central tendencies.
Remember if you have any questions or doubts, make sure to ask those in the comment section below. I generally try to respond every few hours to the new comments so if you want any help, do comment. I will see you in the next one.
